Building aggregated and detailled views
Overview
The building aggregated view allows to consult and compare the consumption of all Zones within the Building in an aggregated view. You can then compare water consumption as you would do within a given Zone.
The building detailed view, which requires a premium subscription, allows seeing the water consumption of each Zone within the Building in a detailed view.
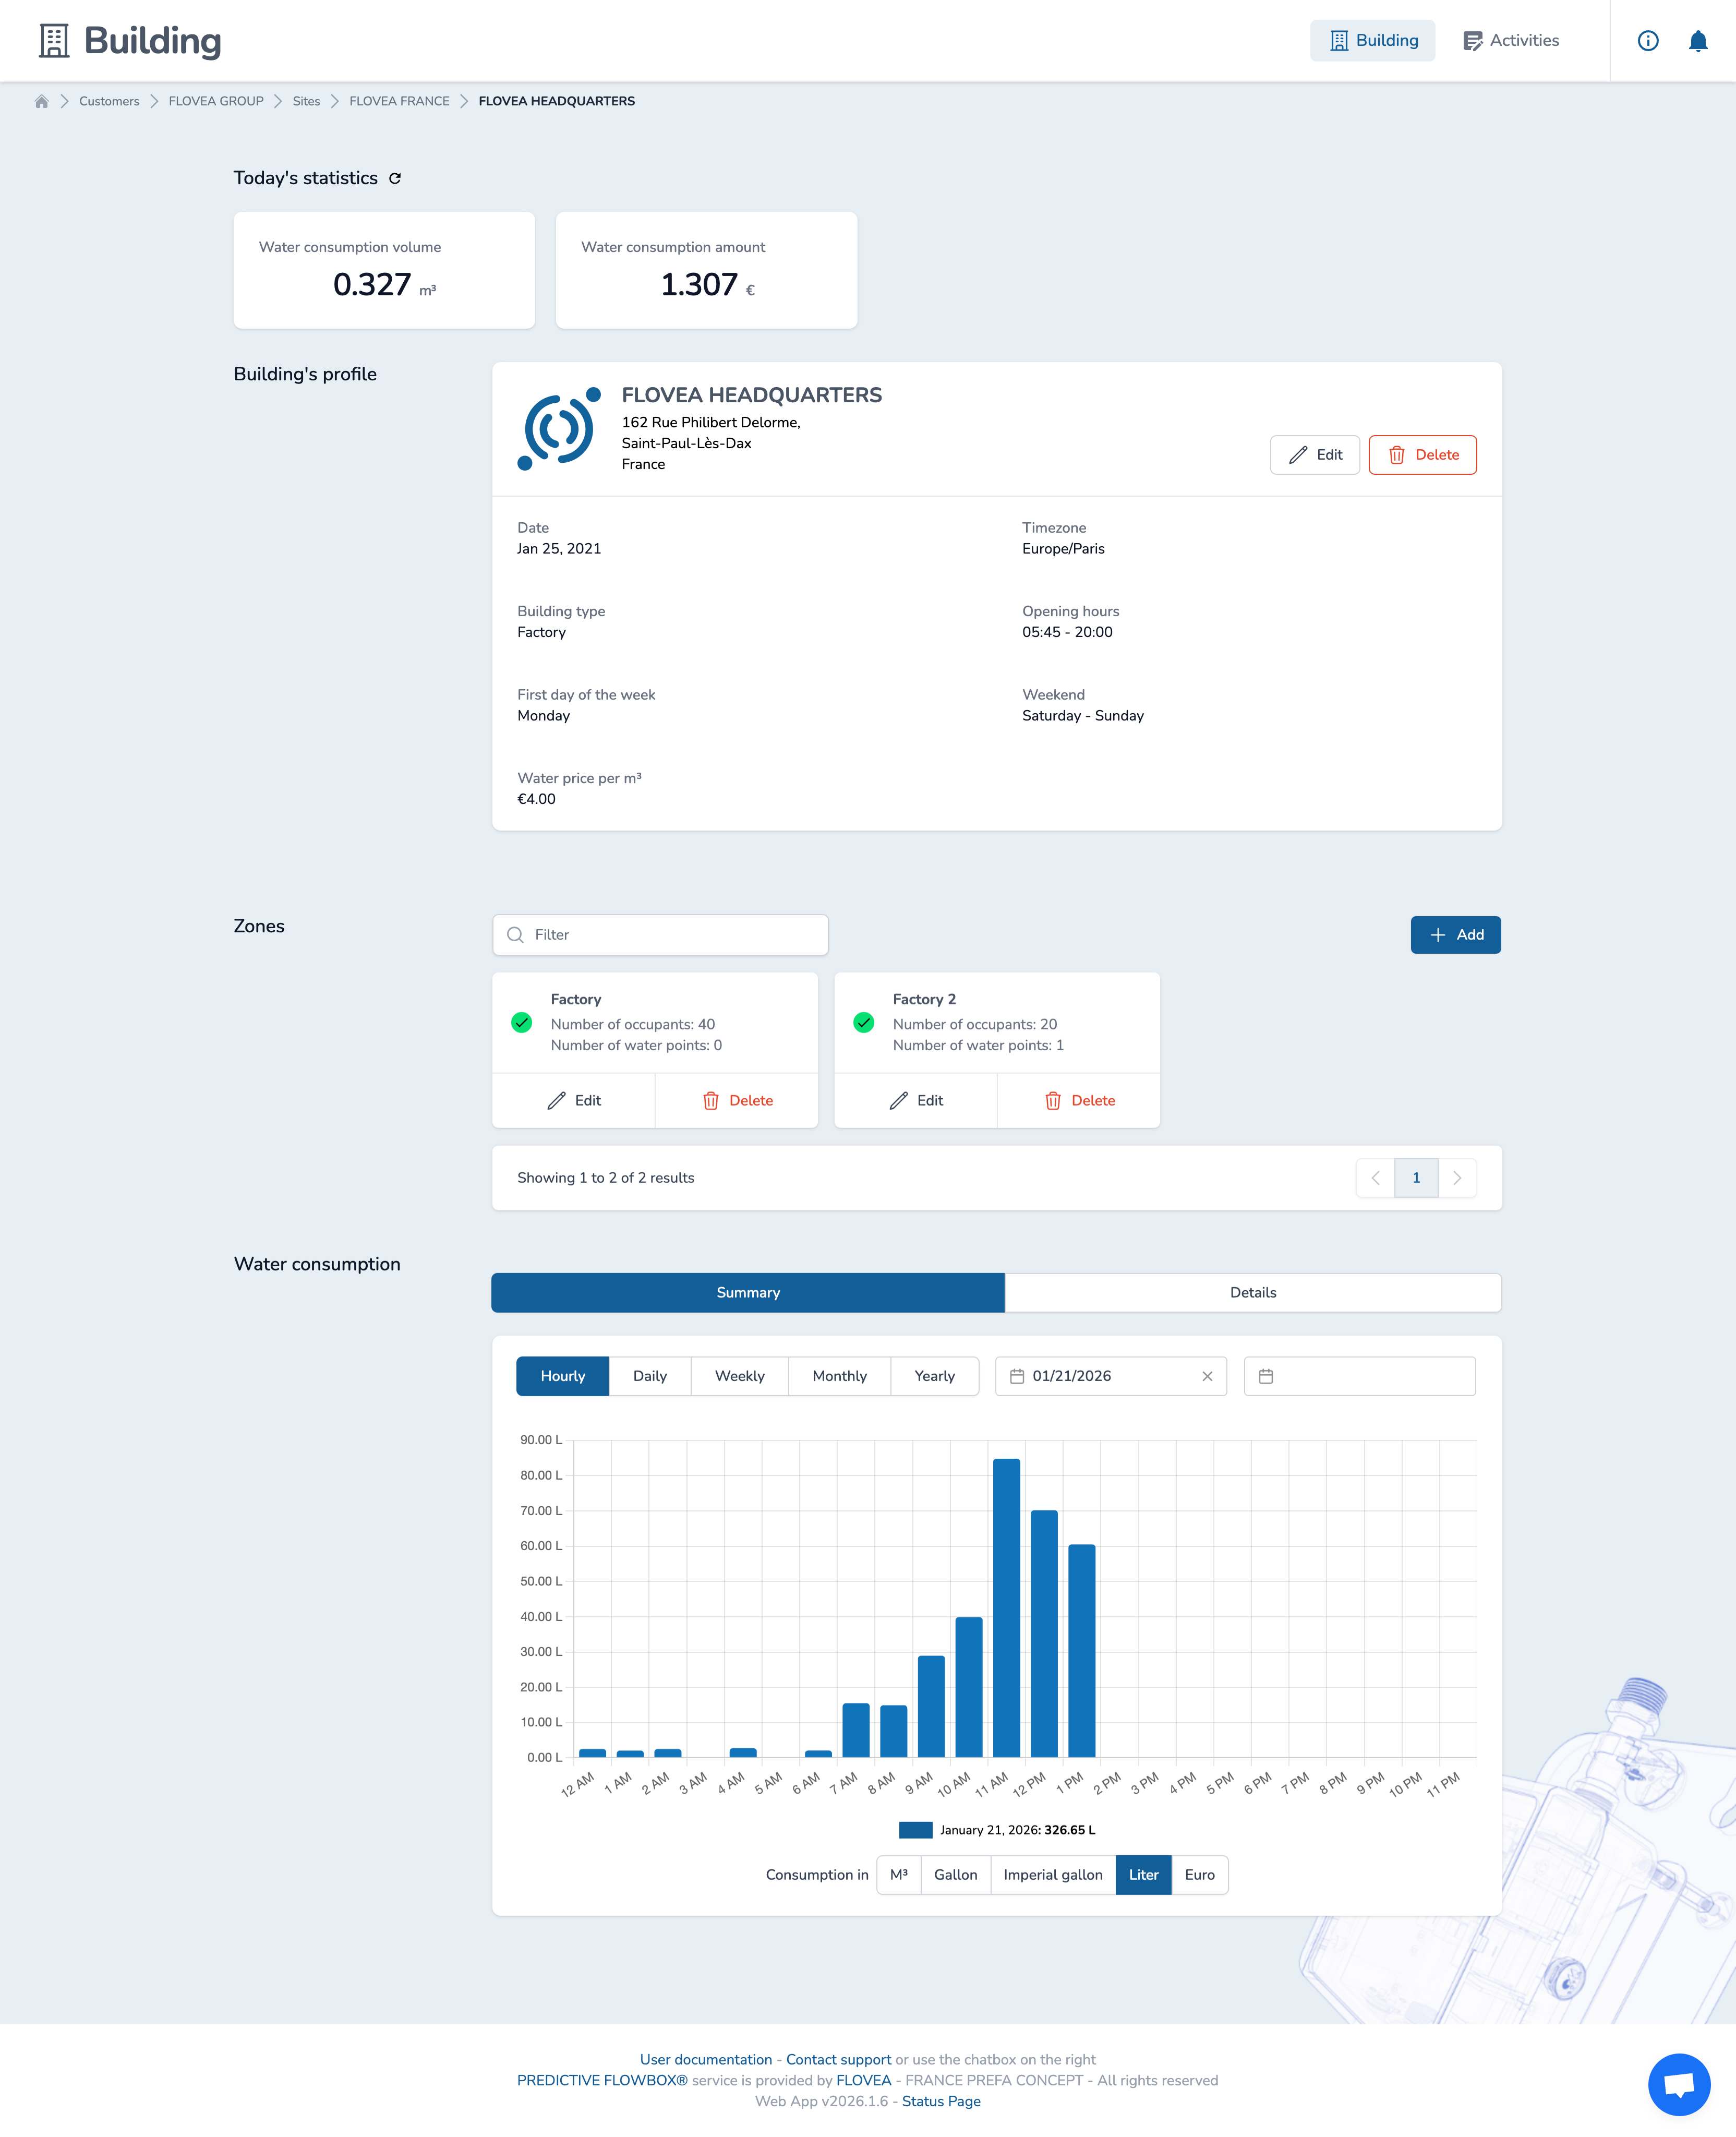
Aggregated view (all plans)
For all plans, the Summary tab is activated by default to access the aggregated view.
This view is available to all users and allows to compute and compare the consumption of all Zones within the Building in an aggregated view.
As for Zones, you can select the time range and the aggregation level (hourly, daily, weekly, monthly, yearly) and compare periods. You can also select the water measurement unit or the currency to display the data in the format you expect.
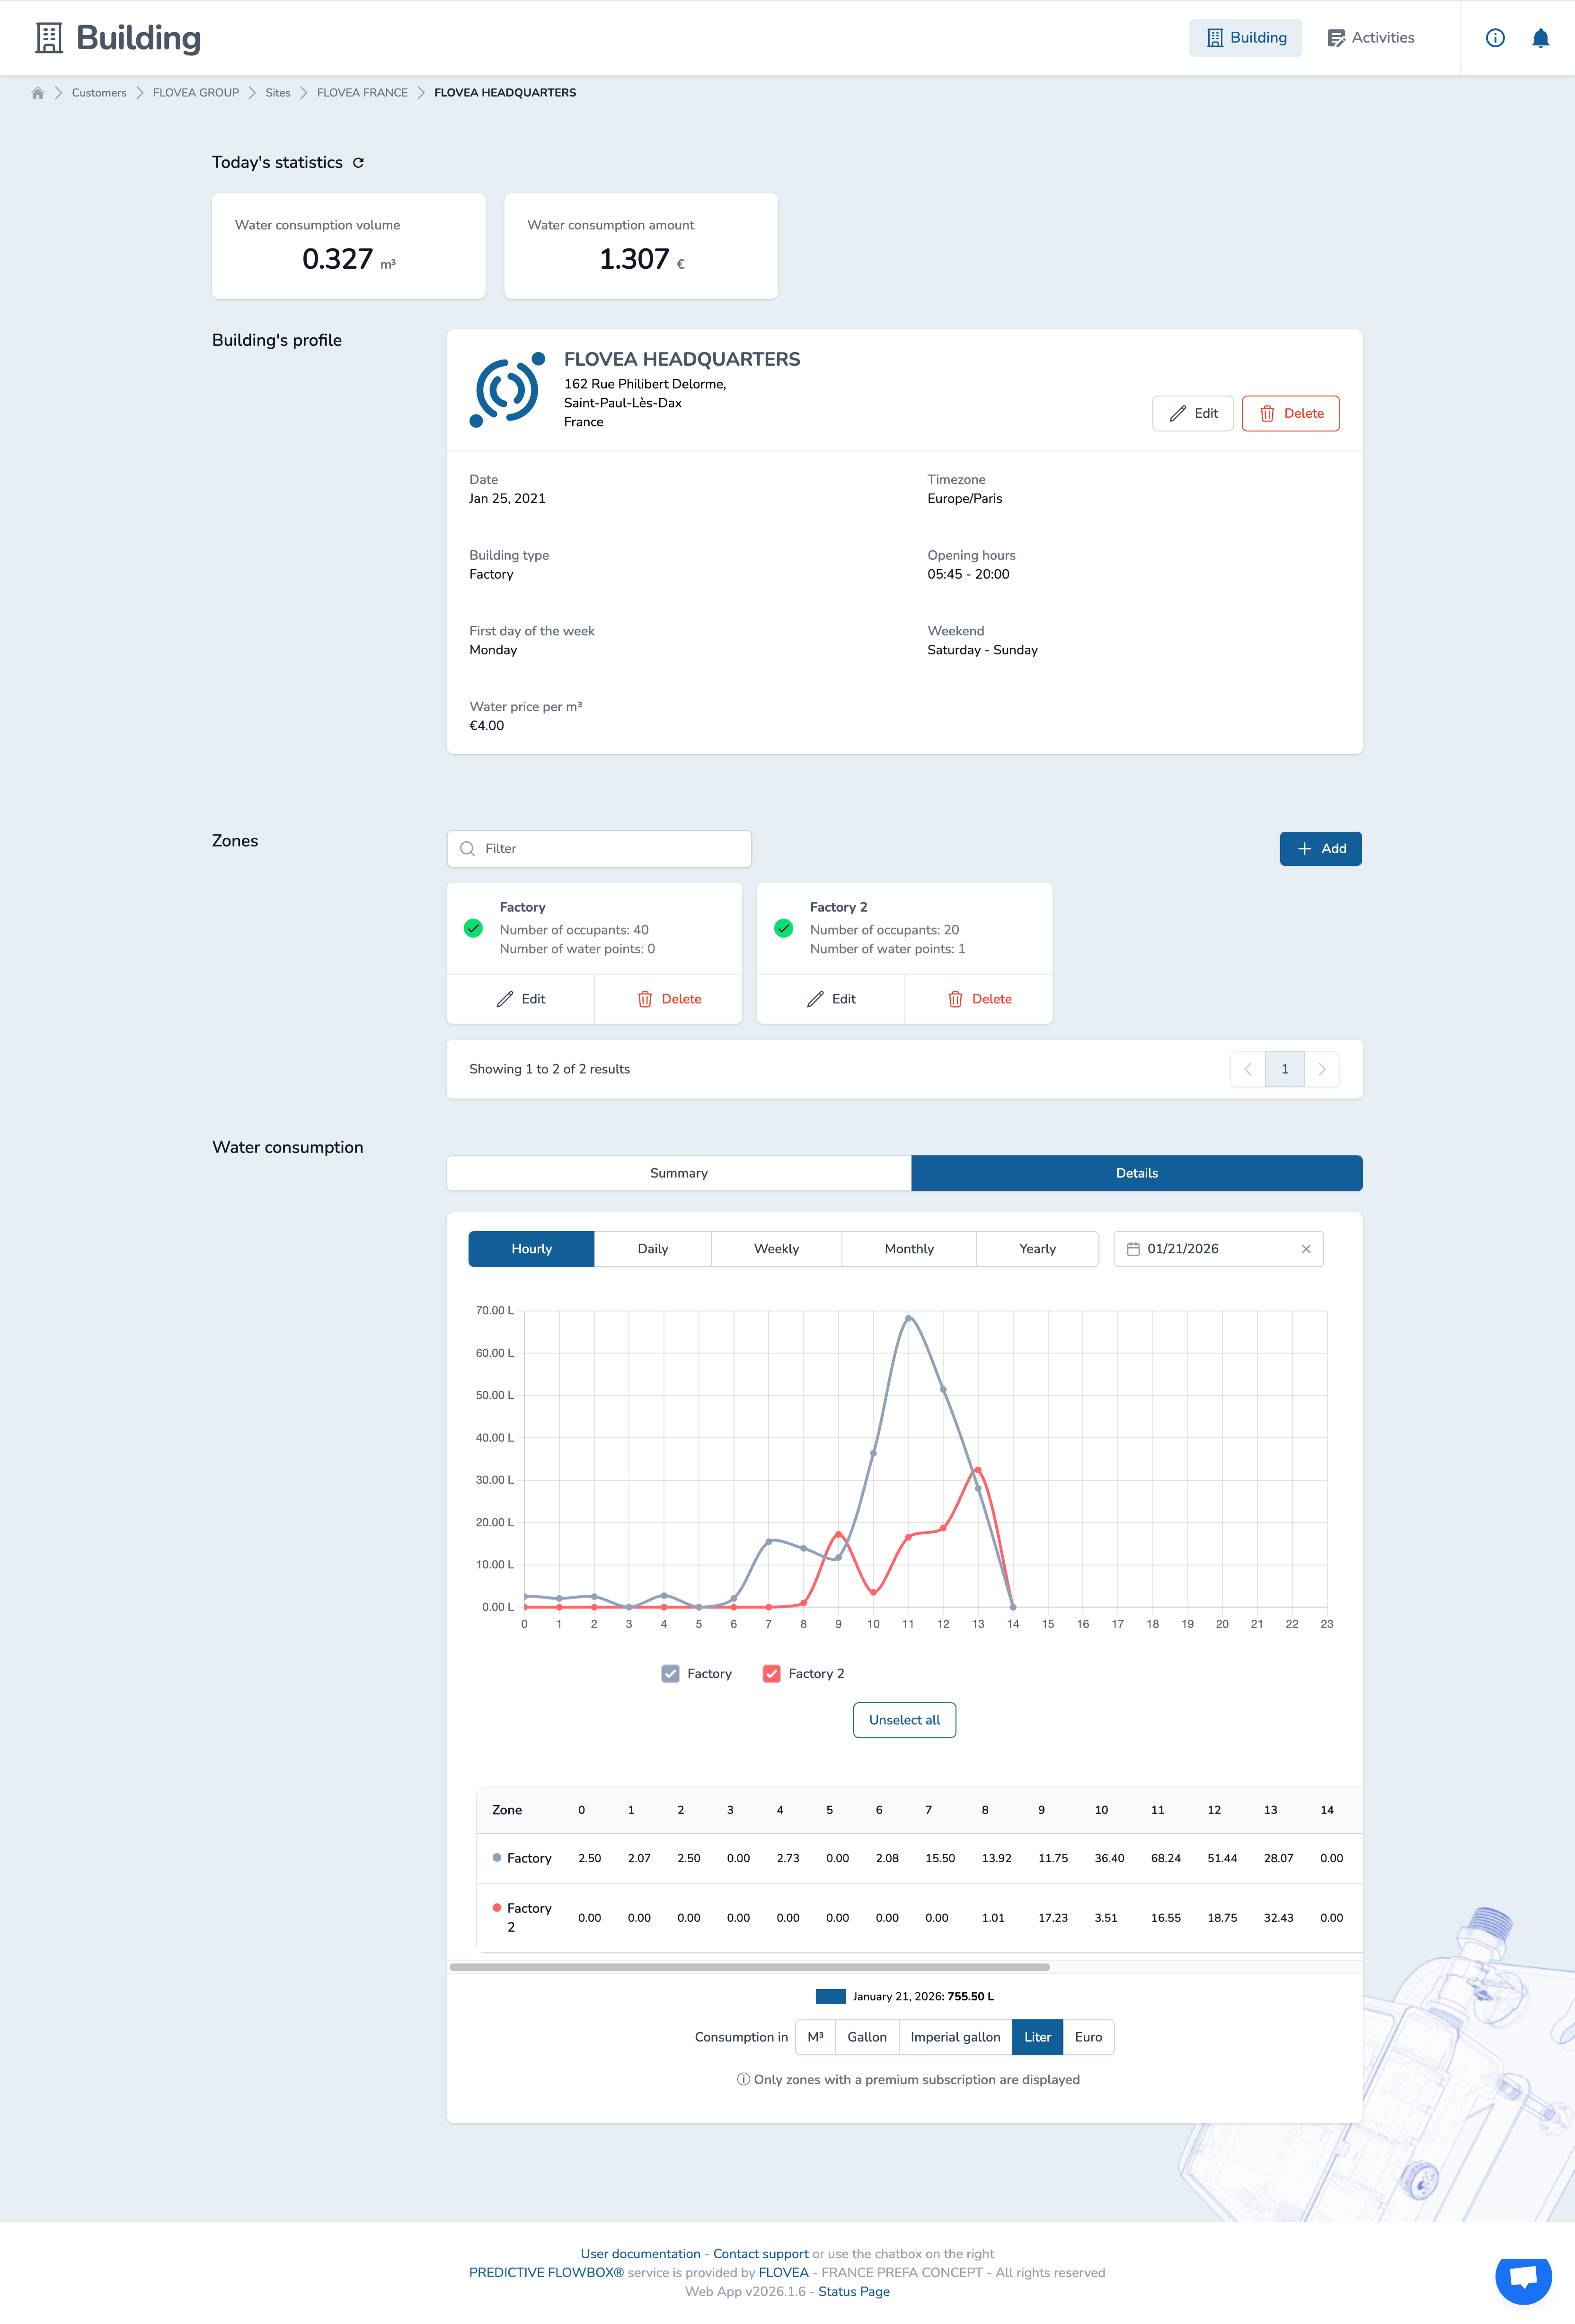
Detailed view (premium plans only)
For premium plans, the "Details" tab is activated to access the detailed view.
On the chart, each Zone is represented by a line. Under the chart, you can access all the data in a table format according to the selected time range.
You can select the water measurement unit or the currency to display the data in the format you expect.