Water consumption in volume/duration & water temperature
Once you are in a given Zone, you can access the water consumption data for that Zone, in termes of volume or duration, and also the water temperature.
Water consumption in volume / currency
First graph will show your current water consumption according to different frequency (hourly, daily, weekly, monthly, yearly). By default, it will display hourly period for the current day.
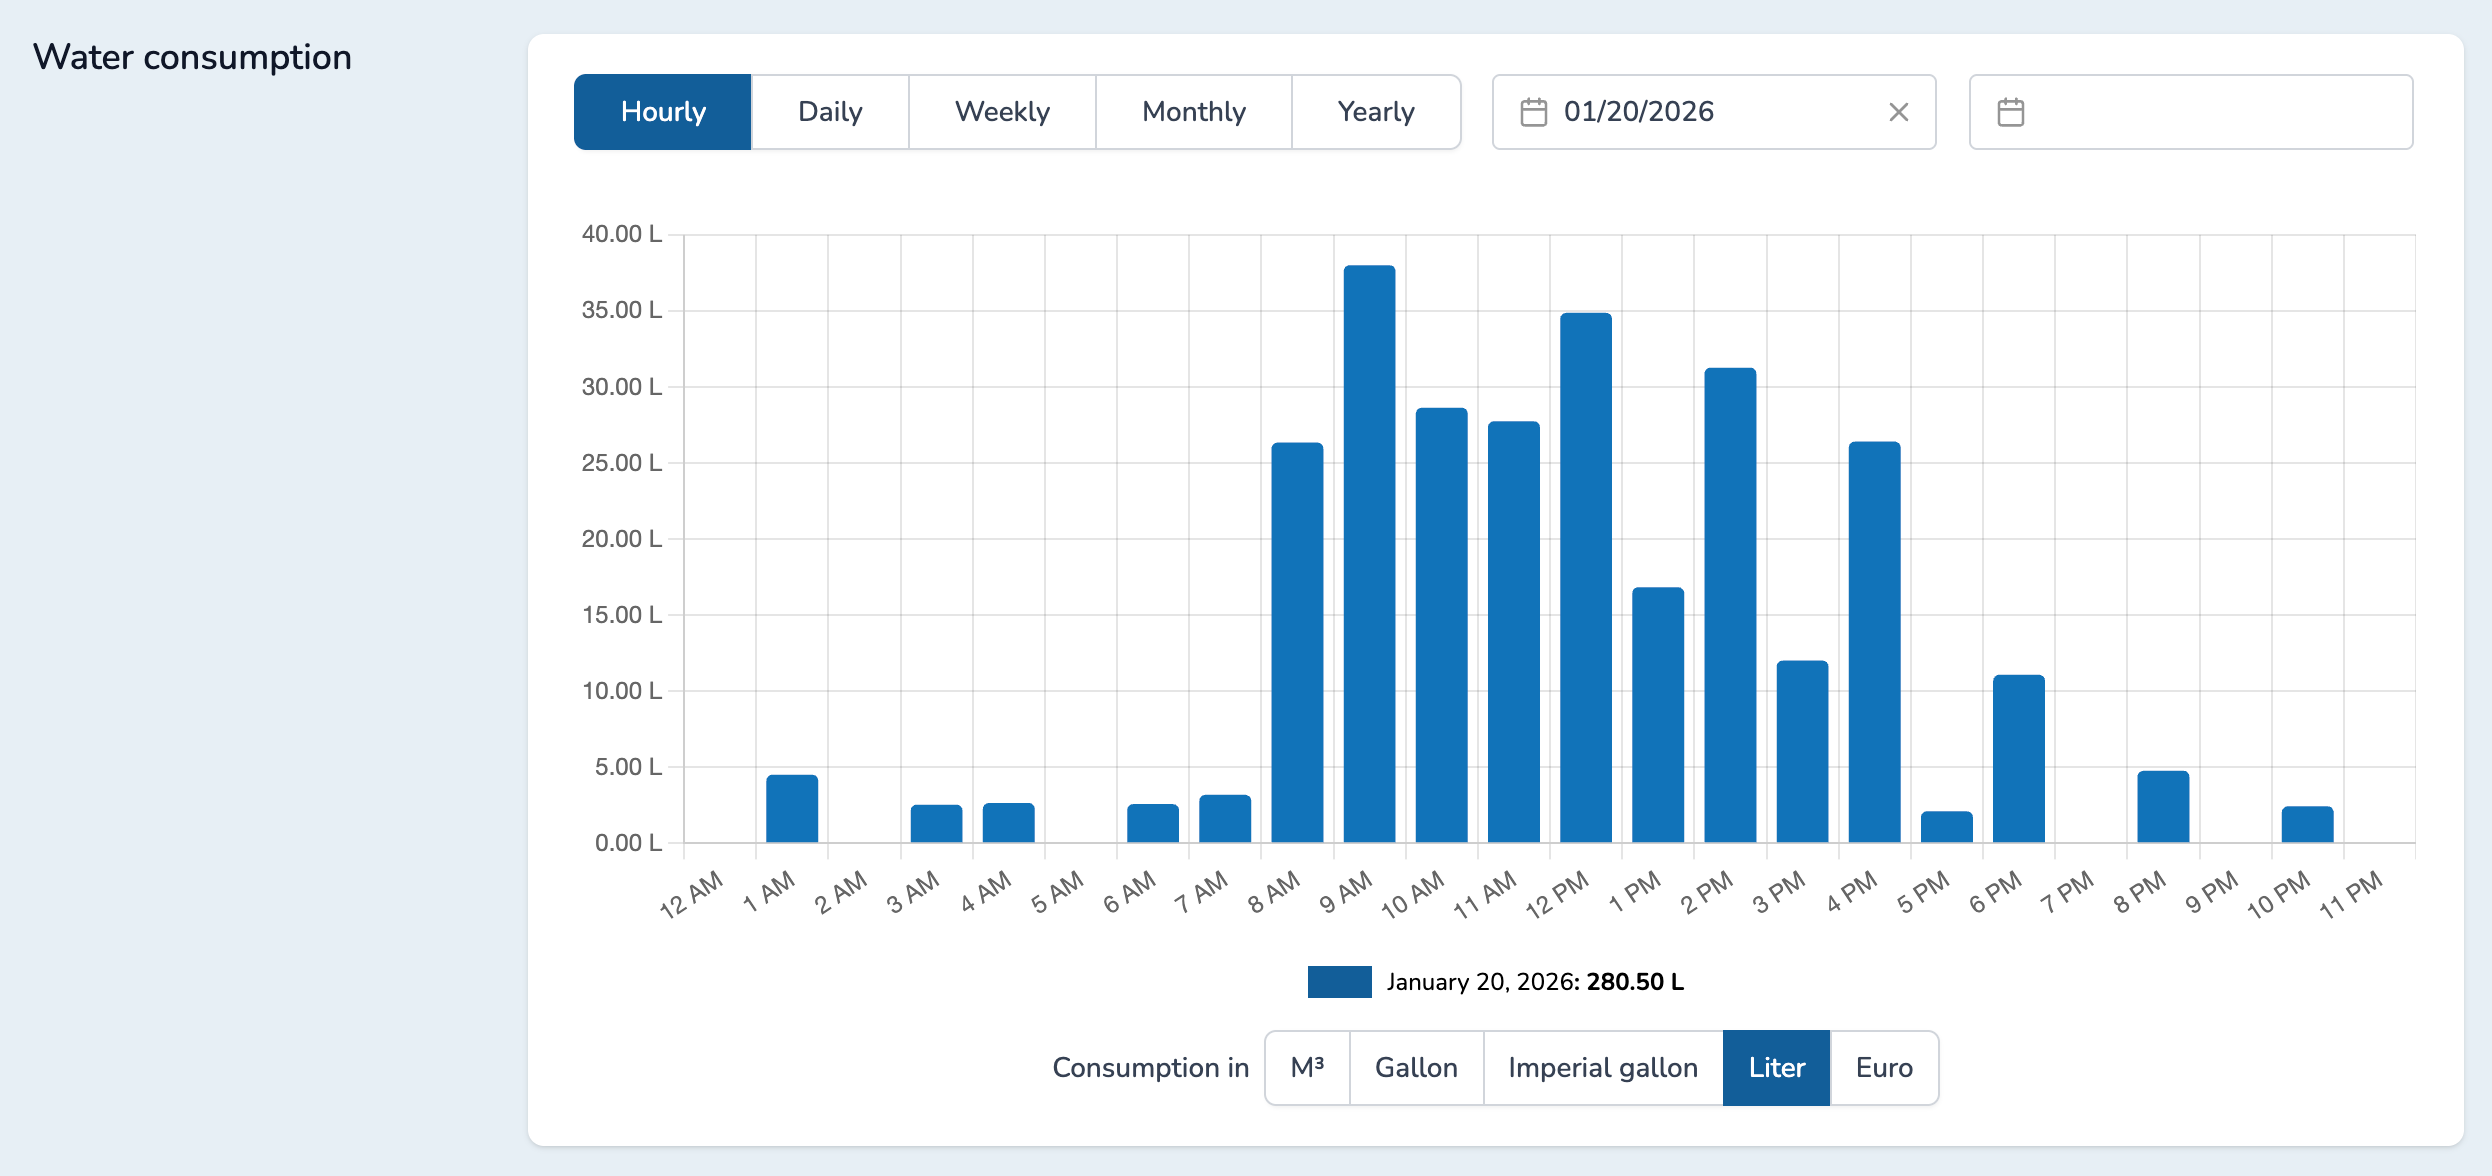
Below the chart, you can see the total consumption for the selected period.
You can also change the water measurement unit by clicking on the desired unit. For the currency, your volume is converted to the appropriate amout based on the value you set per selected water measurement unit.
You can compare periods by selecting a previous period in the second period field.
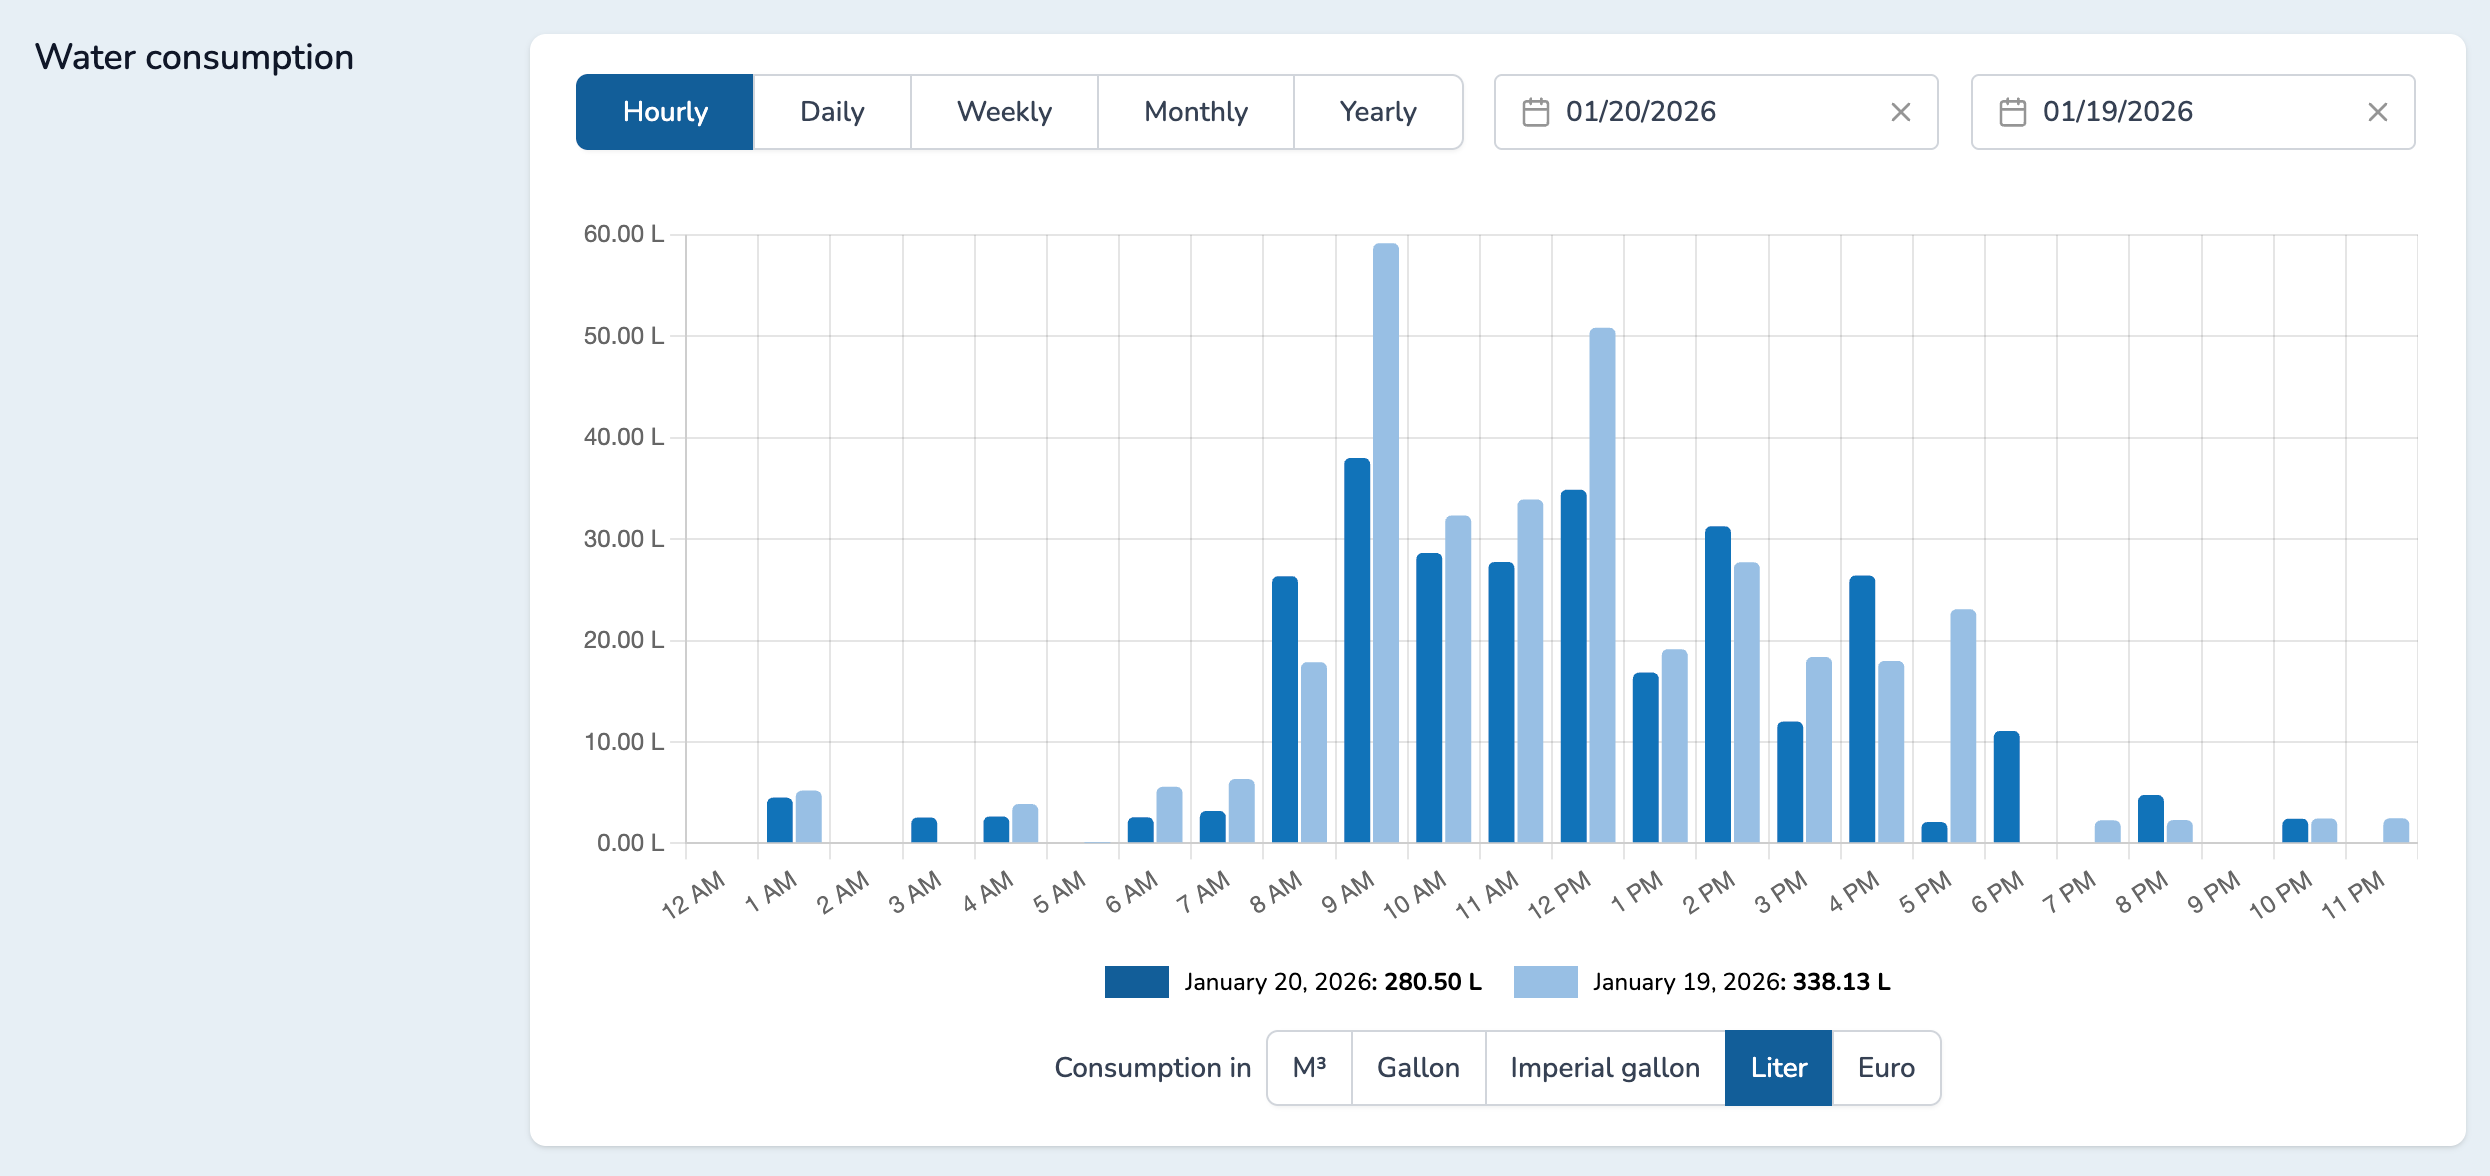
The new data will be displayed in the graph with a lighter color than the default one.
You can end the comparison display by clicking on the "x" button in the top right corner of the graph.
Water consumption in duration
The second graph will show your current water consumption in duration according to different frequency (hourly, daily, weekly, monthly, yearly). By default, it will display hourly period for the current day.
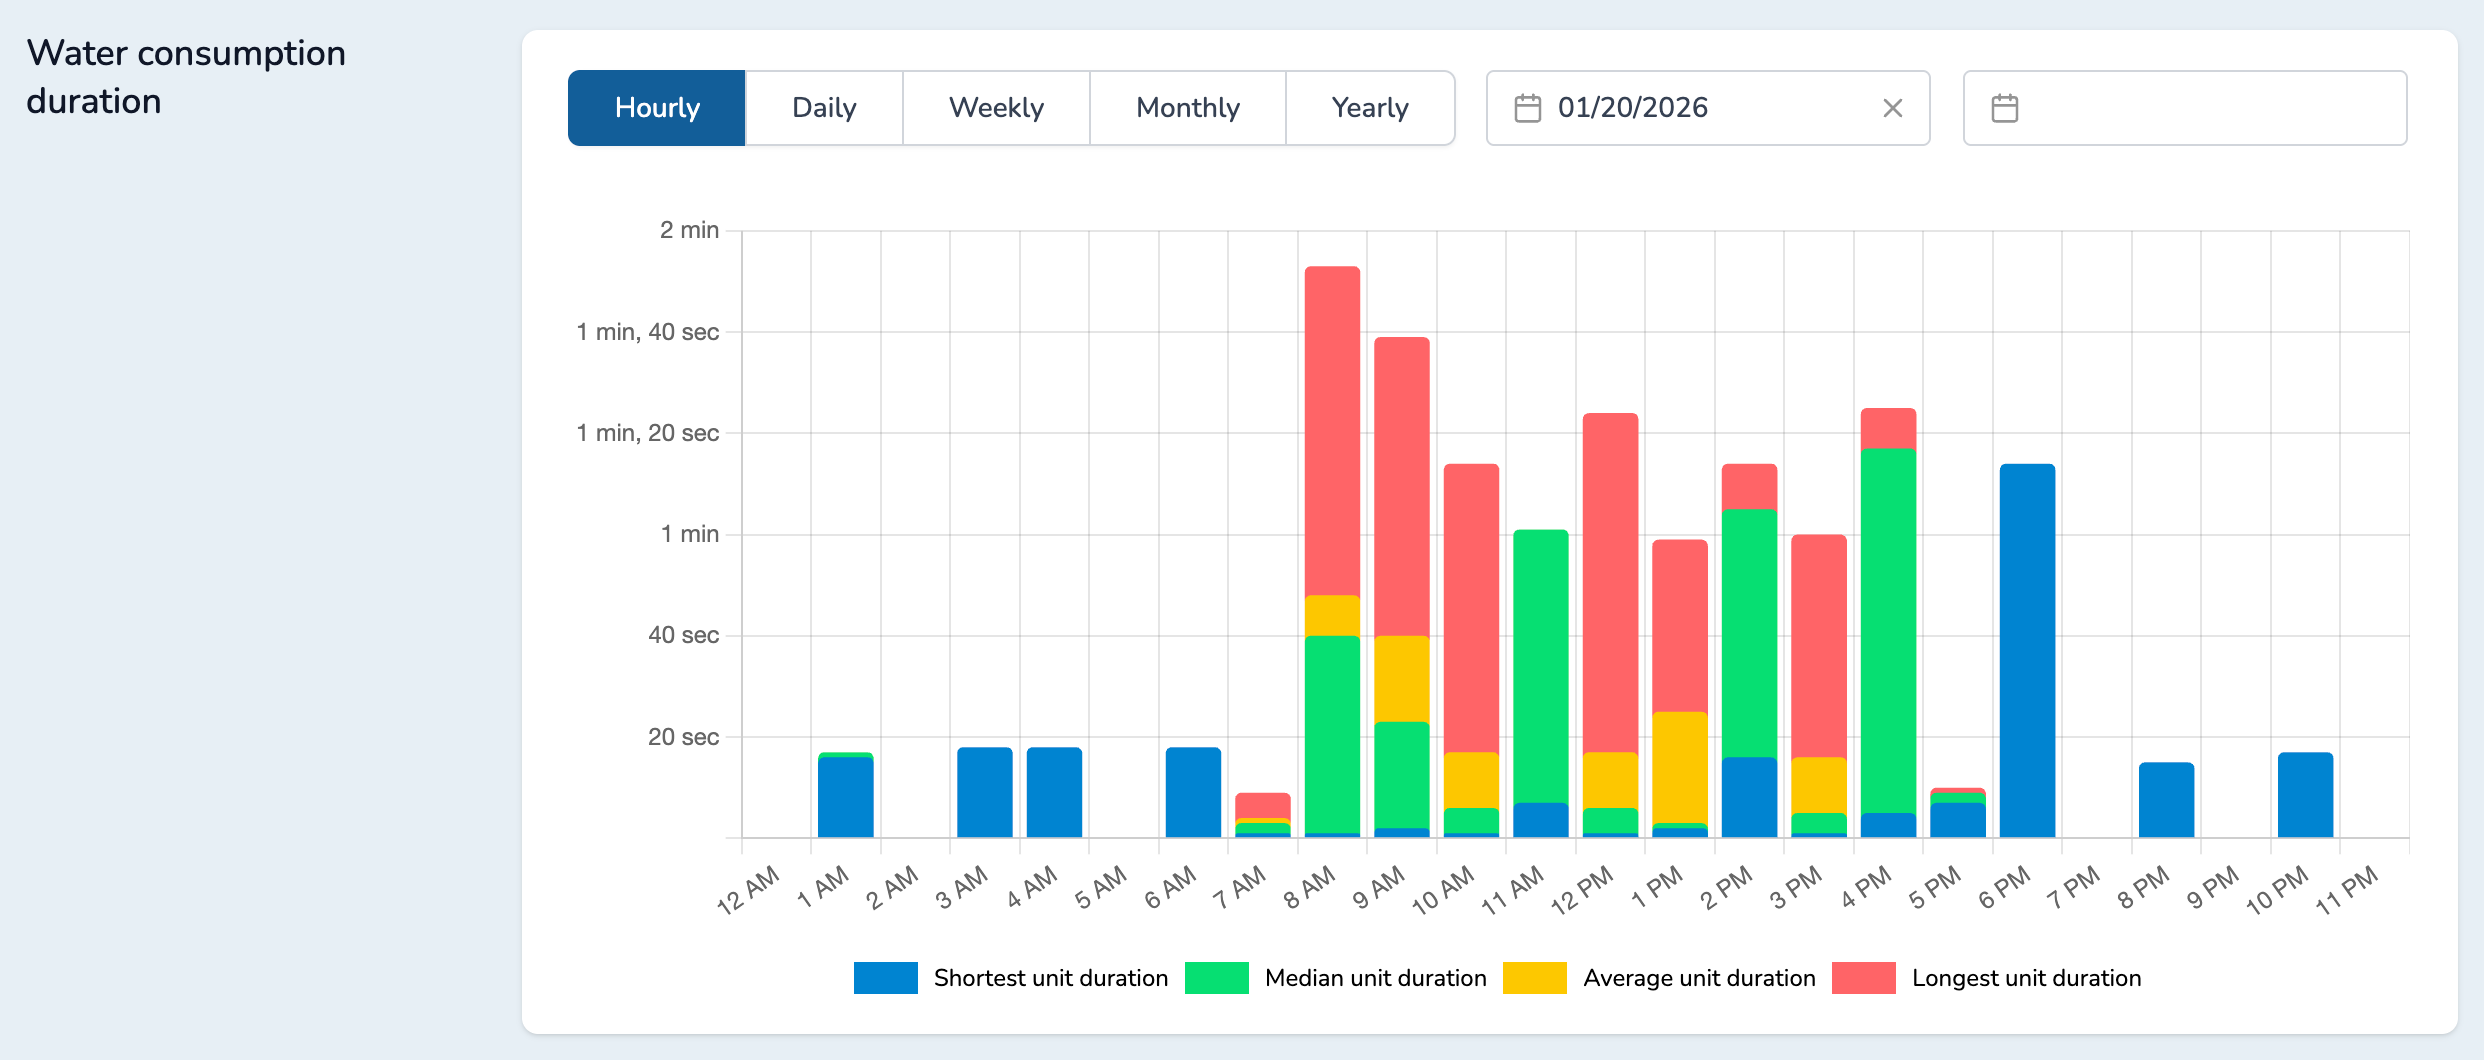
For each period, you can see the minimum, average, median and maximum value.
You can compare periods by selecting a previous period in the second period field.
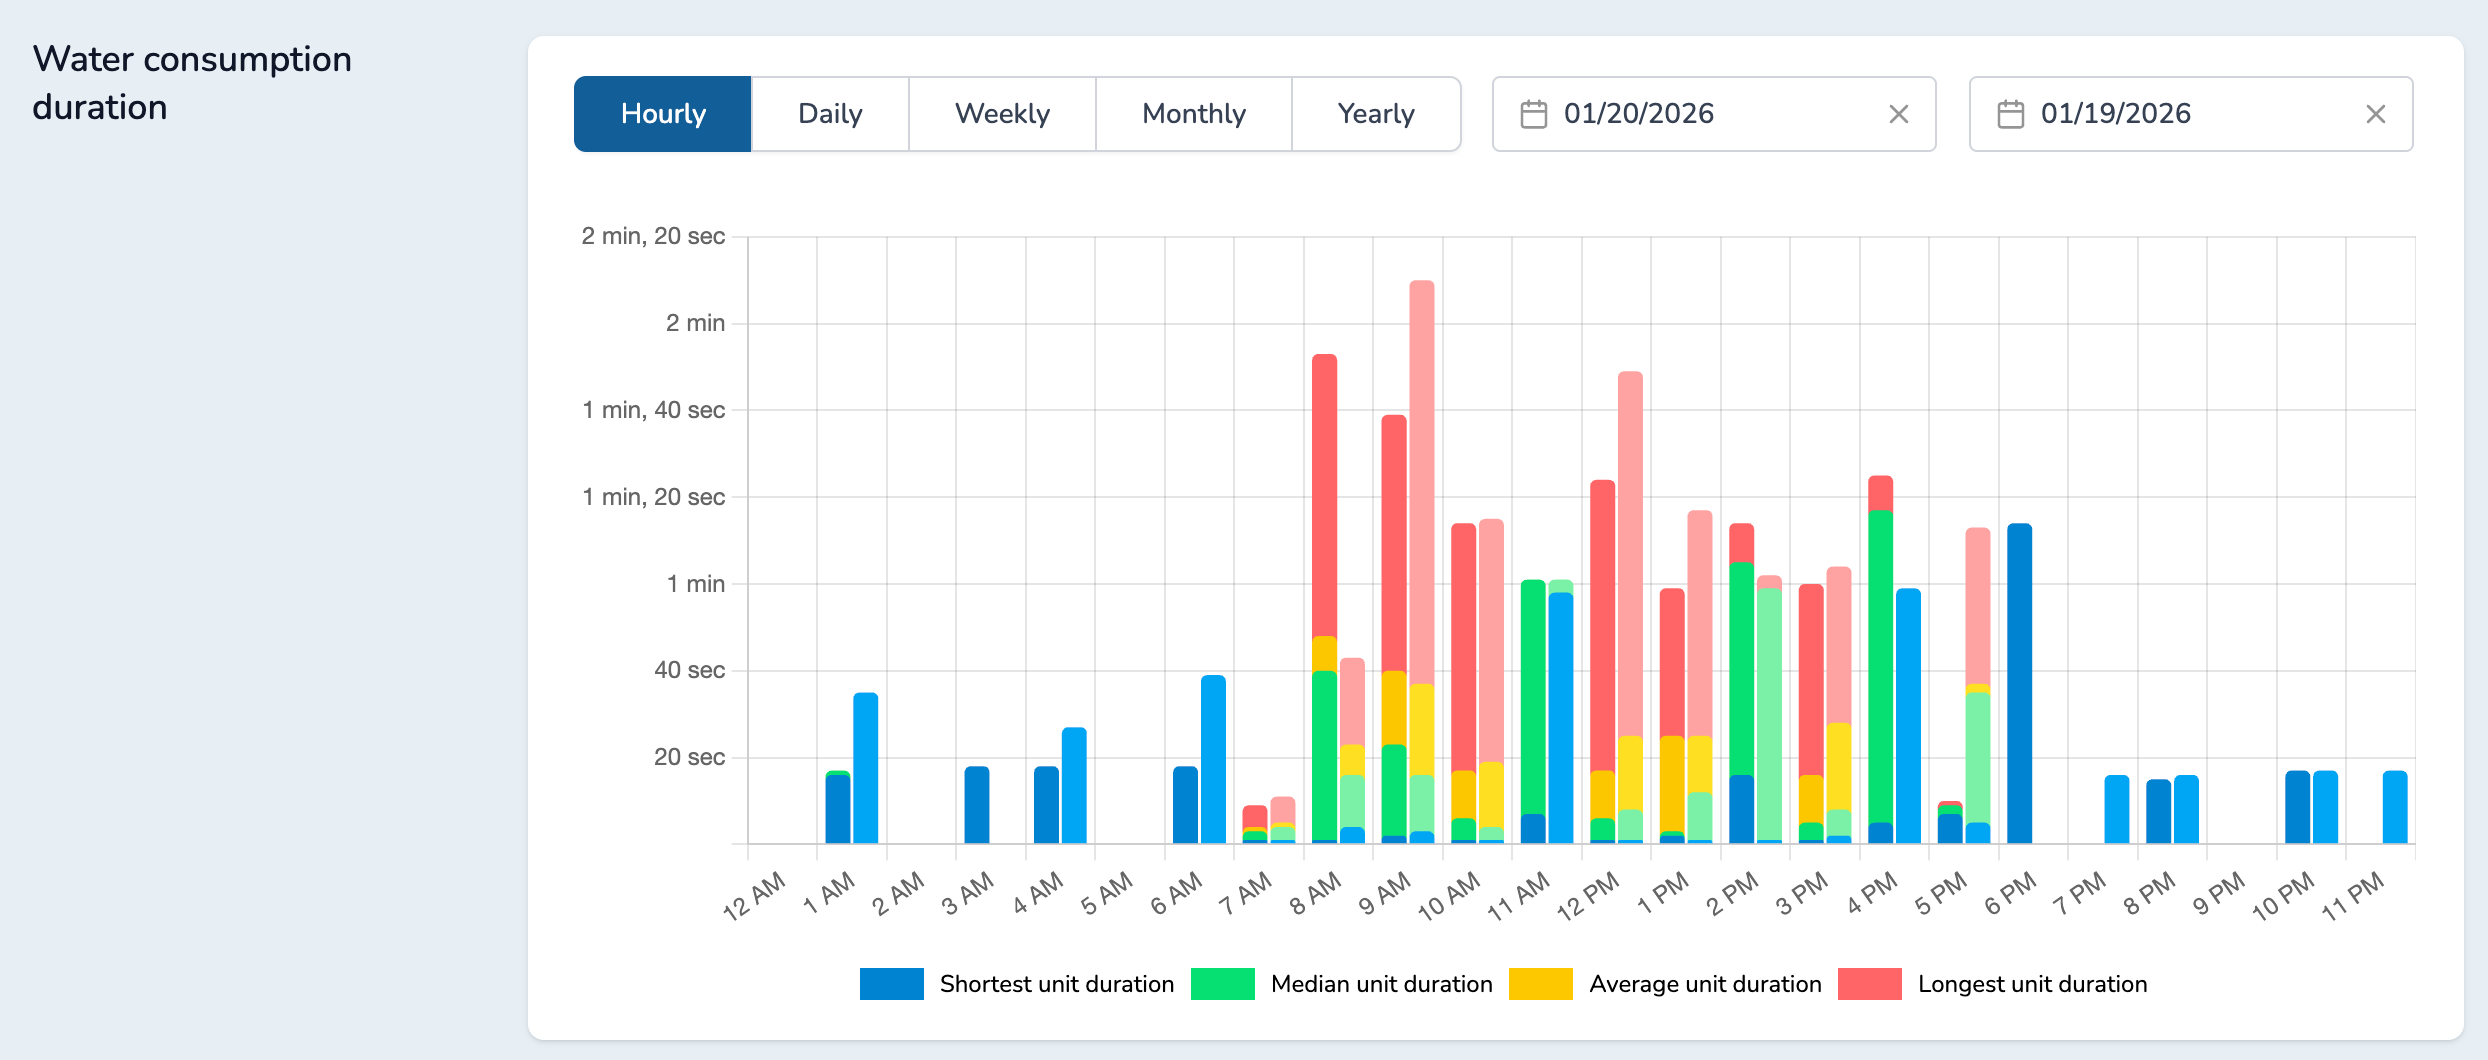
The new data will be displayed in the graph with a lighter color than the default one.
You can end the comparison display by clicking on the "x" button in the top right corner of the graph.
Water temperature
The forth graph will show your current water temperature according to different frequency (hourly, daily, monthly). By default, it will display hourly period for the current day.
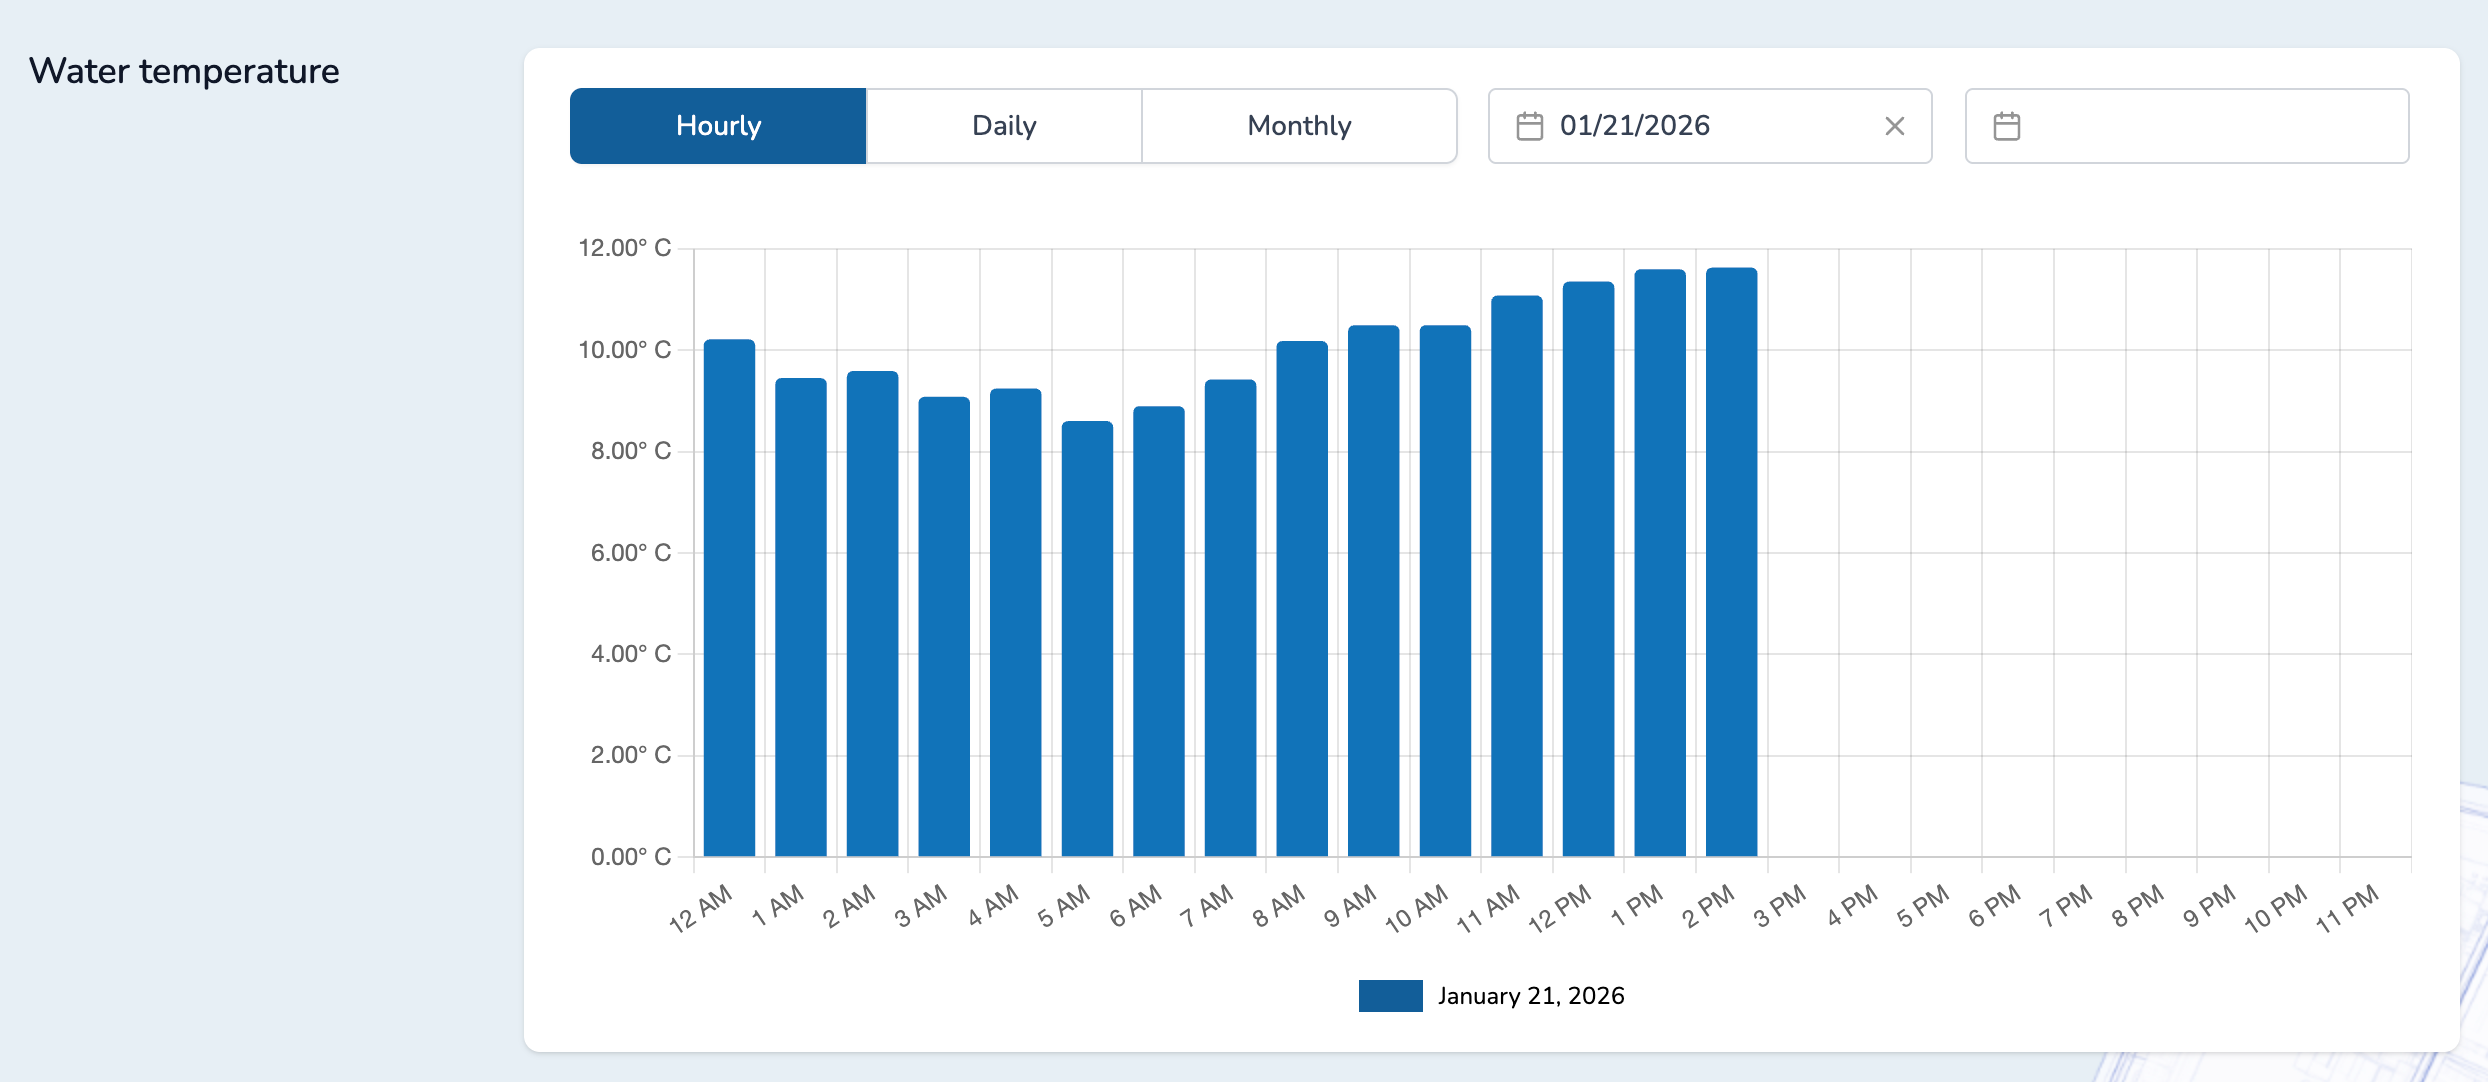
As for water consumption volume and duration, you can compare periods.
Water temperature is used for some analysis such as:
- Burning risks
- Freezing risks
- Bateriological risks